
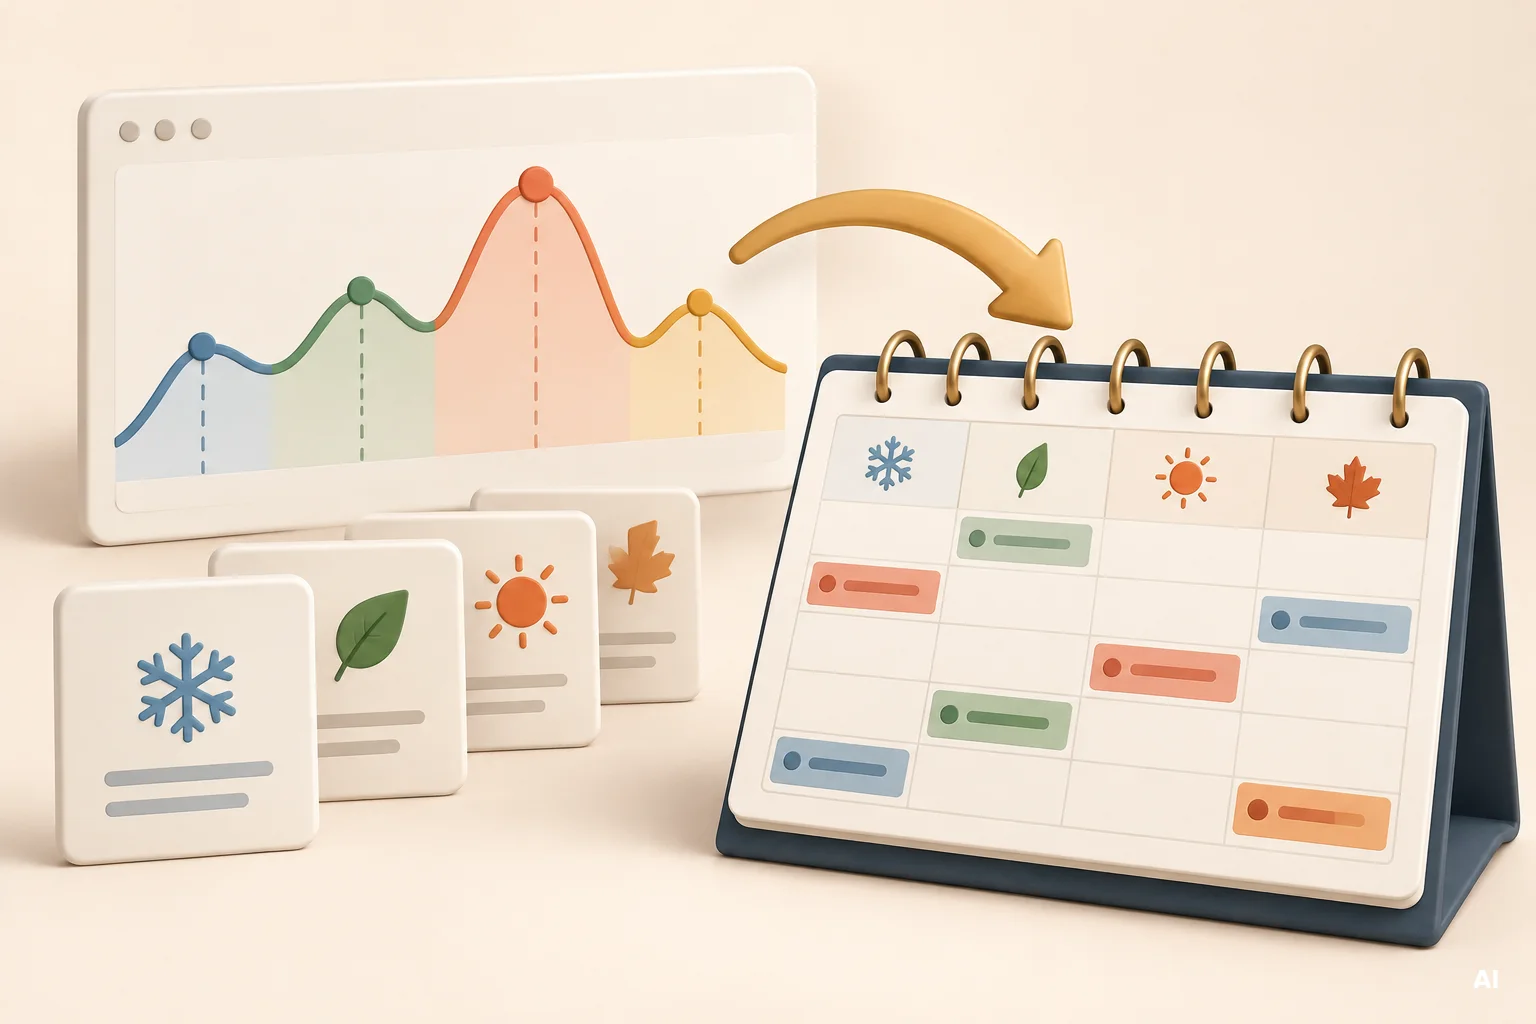
A seasonal content calendar should not begin with publication dates. It should begin with evidence about when demand starts growing, when it peaks, how quickly it declines, and whether the pattern is likely to return. Google Trends helps you identify these patterns, but its relative interest data must be interpreted carefully. The practical goal is to build a Google Trends seasonal content calendar that gives your team enough time to research, create, publish, and improve content before the audience reaches peak interest.
Why Search Seasonality Should Shape Your Content Calendar
Search demand is not distributed evenly throughout the year. Some topics follow annual weather, holiday, financial, educational, retail, or cultural cycles. Others are influenced by recurring industry events, product launches, application deadlines, or planning periods.
If you publish only when a topic is already receiving maximum attention, your page may have little time to be discovered, evaluated, and improved. Competitors with established seasonal pages may already be visible, collecting links, and refining their content based on previous years of performance.
Effective seasonal content planning therefore works backward from expected demand. Instead of asking when an article should be published, ask when interest begins to rise and how much lead time each production stage requires.
Google Trends is useful because it shows changes in relative search interest over time. Its values are normalized and scaled from 0 to 100 within the selected comparison, so a score of 100 marks the highest relative interest in that view rather than a specific number of searches. Different regions with similar scores can also represent different total search volumes.
This makes Google Trends suitable for identifying timing and direction, but not for estimating exact traffic. Combine it with traditional keyword research, tools such as Ahrefs, competitor SEO tracking, and your own Google Search Console data before assigning commercial value or traffic forecasts.
How to Choose a Time Range That Reveals Recurring Patterns
A short time range can make an ordinary fluctuation look important. For seasonal keyword research, use several years of data whenever the topic and available history allow it. A five-year view often provides enough context to see whether peaks occur in similar months each year.
Look for repeated characteristics rather than identical charts. The date and intensity of a peak can move because of weather, changing event schedules, economic conditions, or shifts in how people describe the topic. What matters is whether the broader demand cycle returns.
A practical time-range review should move through three levels:
- Multi-year view: identify recurring peaks, long-term growth, decline, and unusual years.
- Past 12 months: examine the latest complete seasonal cycle in more detail.
- Short peak-period view: inspect the weeks around the rise, maximum, and decline to plan publication and updates.
Keep the location, category, and search type consistent while comparing periods. If you change several filters simultaneously, you may not know whether the difference comes from seasonality, geography, or a different search environment.
Also compare relevant topics and query variants. A broad topic may show stable annual demand while a specific phrase is losing popularity. This can signal a change in vocabulary or search intent rather than the disappearance of the underlying need. For a structured comparison process, review how to conduct Google Trends keyword research and search intent analysis.
How to Distinguish Seasonality from One-Time Spikes
A visible spike is not automatically seasonal. Seasonality is recurring and reasonably predictable. A temporary spike may be caused by news coverage, a viral discussion, a regulatory announcement, an exceptional weather event, or the release of a particular product.
Start by checking whether a similar increase appears in previous years. If it occurs only once, investigate the date and context before adding it to an annual content calendar. A one-time event may still justify content, but it belongs in a responsive editorial workflow rather than a recurring seasonal schedule.
Use the following checks to classify the pattern:
- Recurrence: does interest rise during a similar period in multiple years?
- Duration: does demand build over several weeks, or appear and disappear within days?
- Trigger: is the rise connected to a predictable annual need or a specific news event?
- Query structure: are people searching for an enduring topic or for a named event, person, product, or incident?
- Post-peak baseline: does interest return to a normal recurring level or remain permanently higher?
The distinction affects your investment decision. A repeatable peak can support an evergreen page that is refreshed each year. A short-lived spike may require a fast article, an update to an existing page, or no action if it lacks relevance to your audience.
Trending Now is designed to surface queries experiencing a recent surge associated with newsworthy stories, while the Explore view is more appropriate for examining a topic over longer periods. Use both views for different purposes: immediate discovery and historical validation. You can also evaluate rising queries and breakout searches before treating sudden growth as a durable opportunity.
How to Map Peak Interest by Topic and Region
A national or global trend can hide important regional differences. Seasonal demand may begin earlier in warmer locations, follow different school calendars, reflect local events, or use region-specific vocabulary. A single publication date may therefore be inefficient when a business serves several markets.
Google Trends regional scores represent relative popularity within each location. They do not show which region generates the largest absolute number of searches. A smaller market can receive a higher relative score even while producing fewer searches overall.
For each important topic, compare:
- countries, states, regions, or cities relevant to the business;
- the month or week when interest begins to rise;
- the timing and intensity of the peak;
- regional query variants and terminology;
- whether the difference is large enough to justify localized content.
Do not create separate regional pages merely because the map uses different shades. Localization is worthwhile when the timing, intent, terminology, offer, or recommended action genuinely differs. Otherwise, one strong page with relevant regional sections may be more useful and easier to maintain.
If geography materially changes the opportunity, use a dedicated process to compare seasonal demand by region. Record regional findings directly in the calendar so that teams do not assume every market follows the same schedule.
When to Research, Create, Publish, and Refresh Seasonal Content
The right publication date depends on the shape of the demand curve and the complexity of production. A narrow trend that rises quickly requires a different workflow from a topic whose interest grows gradually over three months.
Work backward from the expected peak and assign dates to the following stages:
- Research: validate recurrence, search intent, keyword variants, regional timing, and existing competitor coverage.
- Briefing: define the page purpose, primary query, supporting questions, format, internal links, and conversion path.
- Production: write, design, review, approve, and prepare the page for publication.
- Publication: make the page available before demand reaches its maximum.
- Pre-peak refresh: update dates, examples, availability, links, and calls to action as the season approaches.
- Post-season review: measure performance and record improvements for the next cycle.
There is no universal rule that every seasonal page should go live a fixed number of weeks before its peak. An established URL may need only a focused update. A new research-heavy guide may require a much longer runway. The calendar should reflect the real lead time of your organization rather than an arbitrary publishing formula.
For existing pages, review historical impressions and clicks before the expected rise. Google Search Console allows performance analysis by date, query, page, country, device, and search type. Weekly or monthly views can also reduce distracting daily fluctuations when you evaluate longer-term patterns.
Google Trends indicates broader market direction, while Search Console shows how your website appeared and performed. The two datasets answer different questions. Use Trends to anticipate demand and measure seasonal content with Google Search Console once your pages have visibility.
How to Prioritize Recurring and Event-Driven Opportunities
A content calendar cannot include every recurring topic or emerging event. Prioritization should reflect audience relevance, business value, timing confidence, production effort, and the website’s ability to provide a credible answer.
A simple scoring framework can help you compare opportunities:
- Pattern confidence: how consistently has the demand returned?
- Audience fit: does the topic address a real need of your intended customer?
- Search intent fit: can the planned page satisfy what people are trying to accomplish?
- Business relevance: is there a natural connection to the organization’s expertise or offer?
- Competitive feasibility: can you create something meaningfully useful compared with current results?
- Reuse potential: can the page be refreshed rather than rebuilt every year?
- Production risk: can the team publish early enough to benefit from the opportunity?
Recurring opportunities usually deserve earlier planning because they can become reusable assets. Event-driven opportunities require more caution. A planned industry event may be predictable, but the queries, speakers, announcements, and search intent surrounding it can change each year.
Competitor ranking data can add context, but it should not become the sole decision criterion. A competitor’s visibility may reveal an underserved format or content gap, yet it does not prove that the topic supports your objectives. Prioritize the user need first, then use competitor SEO tracking to evaluate how difficult and differentiated the response must be.
How to Build a 12-Month Google Trends Seasonal Content Calendar
A useful calendar should show more than article titles and publication dates. It should make dependencies visible and help the team act before demand rises. Begin with topics that have evidence of recurring interest, then add predictable events and a limited amount of capacity for emerging opportunities.
For every planned item, record:
- topic and target search intent;
- primary and supporting keywords;
- relevant country or region;
- historical rise period and expected peak;
- research and briefing deadline;
- production owner and estimated lead time;
- review and approval date;
- publication or update date;
- required internal links;
- pre-peak verification date;
- post-season performance review date;
- decision for the next cycle: retain, expand, consolidate, or retire.
This structure connects content calendar SEO with operational ownership. It also prevents a common failure: identifying a useful seasonal topic but scheduling the work too late for the team to complete it properly.
A Practical Monthly Planning Process
You can build the first version of the calendar in five steps:
- Collect candidate topics. Use existing keyword lists, customer questions, product cycles, editorial plans, competitor research, and related queries. You can also find content ideas with Google Trends.
- Validate seasonality. Review several years of interest data and separate recurring demand from exceptional spikes.
- Assign each topic to a demand window. Record the expected rise, peak, and decline rather than placing the topic in a month based only on intuition.
- Calculate lead times. Work backward to set research, production, publication, refresh, and review dates.
- Prioritize the calendar. Resolve workload conflicts and protect capacity for the opportunities with the strongest combination of evidence and business relevance.
Do not fill every month to maximum capacity. Seasonal work can collide with product launches, operational changes, or unplanned updates. A calendar without spare capacity may look efficient but often becomes unreliable as soon as one task is delayed.
If your team struggles to prioritize planned articles or manage publication, refresh, and review dates consistently, you can check whether SEOAssistant.pro could help with your content planning. The free assessment uses public information to evaluate whether the application fits the website and which supported planning or content workflows may be relevant. It is an assessment of fit, not a replacement for editorial approval, implementation, or performance review.
How to Review Performance After the Seasonal Peak
The post-season review turns one year of activity into a better plan for the next. Do not evaluate the page only by total clicks. A strong review considers whether the page became visible before peak demand, matched the intended queries, supported useful actions, and maintained performance throughout the season.
Review the following evidence:
- impressions and clicks before, during, and after the expected peak;
- queries that triggered the page and whether they matched the planned search intent;
- countries, regions, and devices associated with performance differences;
- changes in click-through rate and average position;
- internal links that supported discovery and user navigation;
- competitor ranking changes during the same period;
- content sections that require updated facts, dates, or examples;
- production delays that reduced the available runway.
Compare equivalent periods where possible. A year-over-year view is usually more informative for seasonal pages than comparing the peak month with the immediately preceding month. Google Search Console supports date-range comparisons, but remember that its figures describe your property’s performance rather than total market demand.
Record the conclusions in the calendar. If interest began earlier than expected, advance the next update. If the page gained impressions but few clicks, inspect its title, positioning, and intent match. If the topic attracted demand in an unexpected region, validate whether a localized response would be useful.
Common Seasonal Planning Mistakes
Most seasonal planning errors come from treating a chart as a complete decision rather than one source of evidence. Avoid the following mistakes:
- Using only the past 30 or 90 days: short ranges rarely establish whether a pattern is genuinely seasonal.
- Assuming 100 means high absolute volume: it identifies the peak relative to the selected Trends view.
- Publishing at the peak: this leaves little time for discovery, evaluation, correction, and internal promotion.
- Ignoring regional timing: the same need may rise at different times across markets.
- Treating every spike as recurring: news-driven demand may disappear and never return.
- Changing multiple filters during comparison: this makes the cause of differences difficult to identify.
- Planning topics without production lead times: an editorial opportunity is not actionable until ownership and deadlines are clear.
- Creating a new URL every year: unnecessary duplication can fragment maintenance, links, and performance history.
- Skipping the post-season review: without documented results, the next calendar repeats assumptions instead of using evidence.
Low-volume topics can also produce incomplete or unavailable Trends charts. Google advises expanding the date range, checking spelling, or using fewer comparison terms when there is not enough search activity to generate a graph. In such cases, combine available evidence with Search Console, customer questions, sales data, and other keyword research sources rather than forcing a conclusion.
Key Conclusions for Seasonal Content Planning
A reliable calendar combines market-level patterns with operational discipline. The most important conclusions are:
- Use several years of data where possible to confirm that a peak is recurring.
- Separate predictable annual demand from exceptional and news-driven spikes.
- Interpret Google Trends as relative interest, not exact search volume.
- Compare regions because the timing, language, and intensity of demand can differ.
- Publish before maximum interest rather than reacting after the peak begins.
- Record research, production, approval, publication, refresh, and review dates.
- Validate the plan with search intent, keyword data, competitor analysis, and first-party performance.
- Review results after the season and apply the findings to the next cycle.
These principles make the calendar repeatable. They also clarify when a topic needs a permanent seasonal page, a localized variation, a timely update, or no new content at all.
Summary: Build the Calendar Backward from Demand
The strongest Google Trends seasonal content calendar does not simply label topics by month. It documents when demand begins, how confident you are that it will return, what must be completed before publication, and how results will be reviewed afterward.
Start with multi-year patterns, investigate unusual spikes, account for regional differences, and work backward from the expected peak. Then combine Google Trends seasonality with keyword research, competitor analysis, and Google Search Console performance. This creates a practical decision system: prepare early when the pattern is credible, remain flexible when the evidence is uncertain, and use each completed season to improve the next one.