

The Google Search Console Performance report can show whether organic visibility is improving, but the headline numbers are only the starting point. A rise in impressions does not automatically mean rankings improved, and a lower click-through rate does not always indicate a weak title. Useful analysis requires you to compare equivalent periods, apply the right dimensions, and interpret clicks, impressions, CTR, and position together. If you are new to the platform, begin with the Google Search Console beginner’s guide before working through the process below.
What the Google Search Console Performance Report Shows
The Google Search Console Performance report explains how your property appears and receives clicks in Google Search. Its main chart tracks total clicks, total impressions, average CTR, and average position over the selected period. The table then lets you group that data by queries, pages, countries, devices, search appearance, and dates.
Each dimension answers a different question. Queries reveal what people searched for, while Pages show which URLs appeared in the results. Country and Device help you identify audience-specific differences. Search appearance separates supported result formats when your property has relevant data.
The report measures organic Google Search activity rather than all website traffic. It should therefore be used alongside analytics, conversion, revenue, and business data. Search Console can tell you that clicks changed, but it cannot tell you by itself whether those visits produced valuable outcomes.
Clicks, Impressions, CTR, and Average Position Explained
Clicks
Clicks count qualifying interactions that take a user from a Google Search result to your website. Use clicks to measure the traffic delivered by Search, but remember that a click is not the same as a session, lead, or sale. Google Search Console and analytics platforms use different collection and processing methods, so their numbers should not be expected to match exactly.
Impressions
Impressions indicate how often a link to your property was shown in Google Search under the counting rules for the relevant result type. They are primarily a visibility metric. Rising impressions can result from better positions, visibility for additional queries, increased search demand, new indexed content, or changes in how Google presents results.
Impressions should therefore be interpreted with clicks and position. If impressions rise while average position remains broadly stable, search demand or query coverage may have grown. If impressions and position improve together, stronger organic visibility is a more plausible explanation.
Google Search Console CTR
CTR, or click-through rate, is calculated by dividing clicks by impressions. It indicates how frequently an impression resulted in a click. CTR depends on position, query intent, device, country, brand familiarity, title relevance, snippet presentation, and the other features displayed on the results page.
There is no universal “good” Google Search Console CTR. A branded query in a top position cannot be compared fairly with a broad informational query that appears below videos, images, advertisements, or other search features. Compare CTR within a relevant segment rather than against a sitewide benchmark.
Average Position in Google Search Console
Average position is not a fixed ranking. Google records the topmost position occupied by a result from the property or page for an impression and then averages those values across the selected data. The resulting number can combine different queries, locations, devices, result layouts, and dates.
An average position of 8 does not mean the page consistently ranked eighth. It may have appeared higher for some searches and much lower for others. Narrow the report to a specific query, page, country, and device when you need a more meaningful view, while still treating the result as an average rather than a guaranteed live ranking.
How to Set Date Ranges and Compare Periods
A date comparison should isolate a useful change rather than combine unrelated conditions. Comparing the last 28 days with the previous 28 days is suitable for recent movement. Comparing a month or quarter with the equivalent period in the previous year is usually better for a seasonal business.
Use the following process to create a reliable comparison:
- Open the Performance report for Search results.
- Select the Date filter.
- Choose Compare and select two periods of equal length.
- Use equivalent weekdays where possible.
- Apply the same query, page, country, device, search type, and appearance filters to both periods.
- Review absolute differences as well as percentage changes.
Weekly or monthly granularity can reduce day-of-week noise and make longer trends easier to interpret. You should also account for holidays, promotions, news events, site migrations, content launches, and changes in search demand.
Be careful with the newest data. Preliminary points may be marked with a dotted line and can change as collection finishes. The 24-hour view also includes recent data with only a short delay, which makes it useful for monitoring but less suitable for final reporting.
How to Analyze Search Queries
The Google Search Console Queries tab reveals the searches associated with impressions and clicks for your property. Start by deciding what you want to learn. Reviewing all queries may help you understand topic coverage, but filtering by a page is more useful when you want to discover how people find one specific landing page.
A practical query-analysis workflow is:
- Select a representative date range and an equivalent comparison period.
- Open the Queries tab.
- Sort by impressions to find the searches with the greatest visibility.
- Sort by clicks to identify the main traffic drivers.
- Review CTR alongside average position rather than in isolation.
- Filter by a relevant page to see the queries connected with that URL.
- Filter by a query to see which pages Google shows for that search.
Query and page filters answer opposite sides of the same question. A page filter shows which searches expose this page. A query filter shows which pages appear for this search. The second view can reveal overlapping URLs, changing landing pages, or a page that does not match the intended search need.
Search Console supports containing, excluding, exact, and regular-expression filters for queries. However, rare anonymized queries are omitted from the query table, and applying query filters can change the totals because of privacy protection and data truncation. Filtered branded and non-branded totals may therefore be useful estimates without adding up perfectly to the unfiltered total.
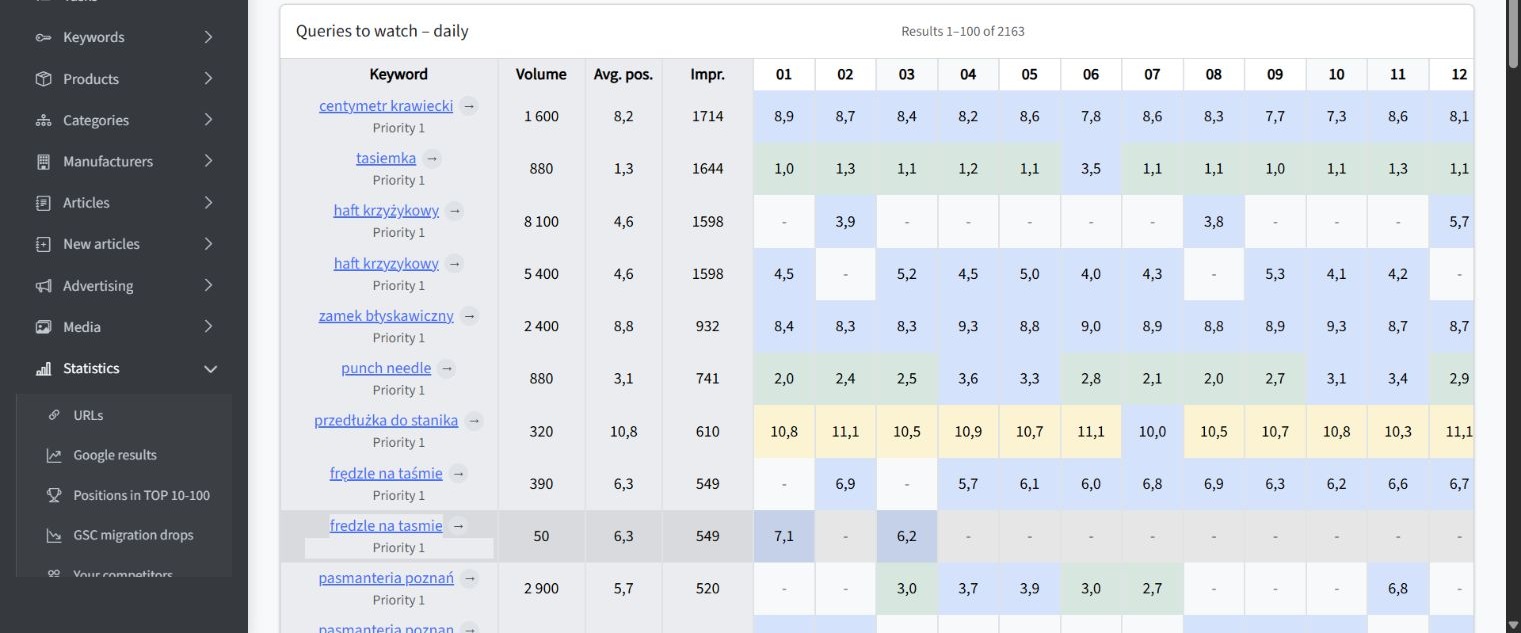
The following example is an SEOAssistant application view based on Google Search Console data, not the native Search Console interface. Captured on October 19, 2026, it shows daily position history for accepted keywords alongside impressions and average position. The day-to-day variations reinforce an important point: reported positions are averages, not fixed rankings guaranteed for every searcher.
How to Analyze Pages and Landing-Page Performance
The Pages tab helps you determine which landing pages gained or lost organic visibility. Compare clicks, impressions, CTR, and average position for individual URLs, but avoid assuming that the same metric change has the same cause on every page.
Begin with three separate views:
- Top pages by clicks to identify the URLs currently producing the most organic traffic.
- Top pages by impressions to find pages with substantial visibility, including underperforming opportunities.
- Largest period-over-period changes to locate meaningful gains and declines.
Once you select a page, switch to the Queries tab. This reveals whether the page is gaining visibility for relevant searches, losing an established query group, or appearing for terms that do not match its purpose.
Most Performance data is credited to the canonical URL selected by Google, and the Pages dimension groups data by the final URL after redirects. If a duplicate or redirected address does not appear as expected, the metrics may be assigned to another canonical page.
When a specific page behaves unexpectedly, you can inspect a page with unexpected search performance to check Google’s indexed information, selected canonical, crawl details, and current live version. Use URL Inspection for an individual URL; use the Performance report to evaluate trends across a wider set of pages.
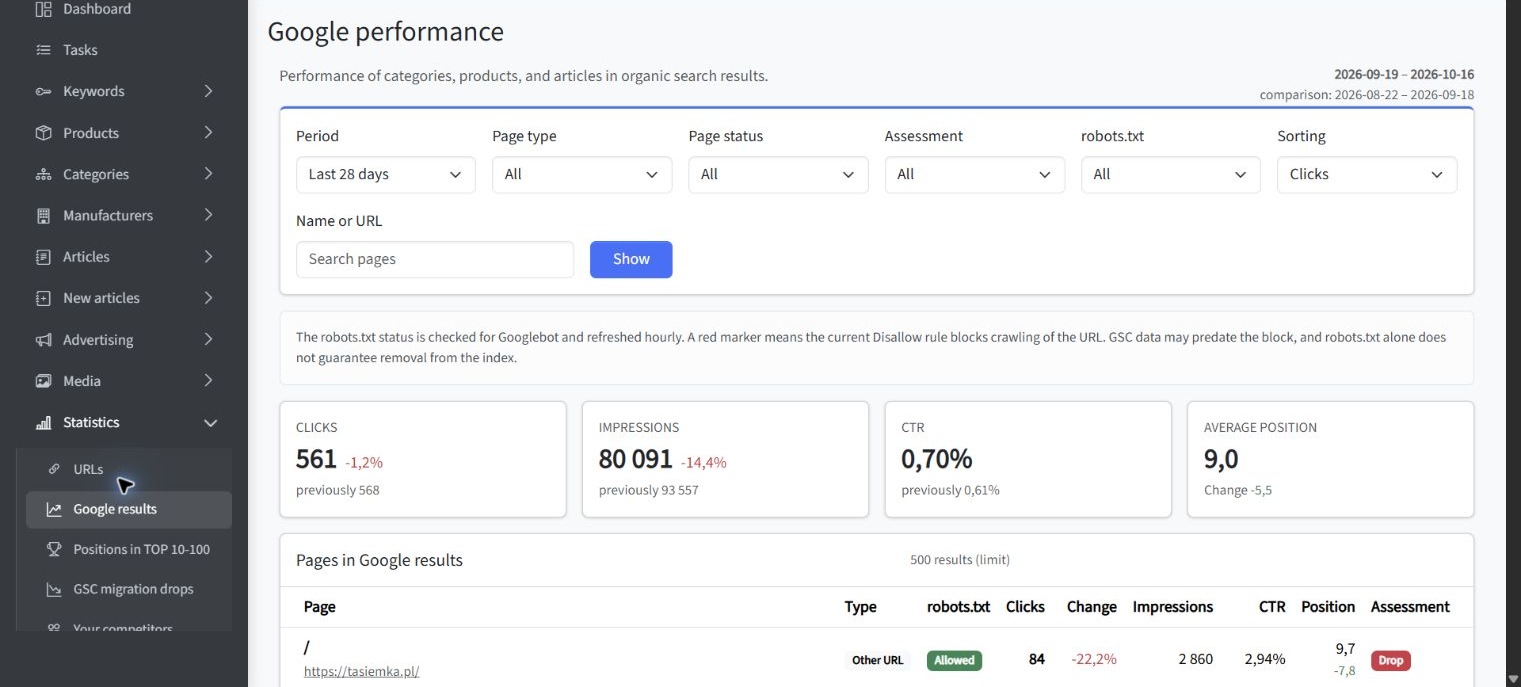
The supplementary view below comes from SEOAssistant, not from the native Google Search Console interface. Captured on October 19, 2026, it presents page-level GSC metrics for tasiemka.pl and supports comparisons involving clicks, impressions, CTR, average position, page types, declines, growth opportunities, and robots.txt status.
How to Use Country, Device, and Search Appearance Filters
Sitewide averages can hide important differences. A page may perform well on desktop but have weak mobile CTR, or gain impressions in one country while losing visibility in its primary market. Country, Device, and Search appearance filters help you test these explanations.
Country
Use the Country dimension to separate markets with different languages, competitors, search demand, and user expectations. If a decline occurs in only one country, a global technical problem becomes less likely. Check whether the affected page is localized appropriately and whether the compared periods contain regional holidays or events.
Device
Compare mobile and desktop when CTR or clicks change unexpectedly. Different screen sizes and search-result layouts can affect what users see before your result. A mobile-specific decline may justify reviewing titles, snippets, page usability, and the result types appearing above your listing.
Search Appearance
Search appearance groups data for supported result formats associated with your property. The available options depend on what Google has recorded for the site, so not every property will display the same categories. Use this dimension to determine whether a change is concentrated in one appearance type rather than affecting ordinary search visibility broadly.
Change one major variable at a time when investigating a problem. If you simultaneously alter the country, device, page, query, and date filters, you may create a segment that is too small or complex to interpret reliably.
How to Find High-Impression, Low-CTR Opportunities
High impressions combined with weak CTR can identify useful optimization opportunities, but only after you confirm that the query is relevant and the position offers a realistic chance of attracting clicks. A page averaging position 40 should not be evaluated like one appearing near the top of the first results page.
Use this workflow:
- Choose a stable period with enough data.
- Open Queries and sort by impressions.
- Identify relevant queries with weaker CTR than comparable queries in similar positions.
- Select a query and open Pages to find the landing URL receiving its impressions.
- Check country, device, and search appearance for concentrated differences.
- Review the live search results to understand intent and competing result formats.
- Improve the page only where the title, description, content, or targeting does not accurately represent the search need.
A title change may help when the existing wording is vague, outdated, or poorly aligned with the page. It will not solve a deeper intent mismatch. If users want a product comparison but the landing page provides only a short category description, the content may need substantive revision rather than a more persuasive title.
After identifying promising queries and pages, a connected SEO workflow can help turn the findings into controlled content improvements with review and measurement steps. Teams working across several platforms may also benefit from understanding how an operational SEO platform compares with common SEO tool stacks. The objective is not to maximize editing activity, but to connect evidence, approval, implementation, and follow-up measurement.
How to Find Pages Losing Organic Search Visibility
A decline in clicks is a symptom, not a diagnosis. Compare the page across equivalent periods and then examine impressions, CTR, position, queries, countries, and devices to narrow the possible causes.
The following patterns provide a practical starting point:
- Clicks down, impressions stable, position stable: investigate CTR, search-result layout, title relevance, and changes in user preference.
- Clicks and impressions down, position broadly stable: consider lower search demand, seasonality, or loss of query coverage that is hidden by the overall average.
- Clicks down, impressions down, position worse: investigate lost visibility, competing pages, content relevance, internal linking, and possible technical issues.
- Position stable but important queries disappear: check whether the page is still being shown for the same search-intent group.
- A decline affects one device or country: investigate that segment before changing the entire page.
- A decline begins after a URL, canonical, or template change: verify indexing, redirects, canonicals, and page accessibility.
Page-level averages can conceal opposing query movements. A page may lose a valuable commercial query while gaining many lower-value informational impressions, leaving its average position apparently unchanged. Always examine the queries responsible for the page’s performance before choosing a response.
Also check whether the decline matches a known reporting anomaly, migration, campaign, algorithmic change, or seasonal event. A timeline can establish correlation, but Search Console data alone cannot prove that one SEO edit caused the result.
How to Separate Brand and Non-Brand Searches
Brand and non-brand queries represent different forms of demand. Branded searches usually come from people already aware of the organization, while non-brand searches can indicate discovery through products, services, problems, or informational topics.
Eligible properties can use the branded and non-branded query filter in the Performance report. Google notes that the classification may occasionally be incorrect, and the feature may not be available for sites with low impression volumes or certain sub-properties.
If the built-in option is unavailable or you need greater control, create a regular-expression query filter covering the main brand name, common abbreviations, product brands, domain variations, and frequent misspellings. Use the same expression consistently in each reporting period.
For example, a business known as both “Example Company” and “ExampleCo” could define one filter that includes both variations. The corresponding exclusion filter would approximate non-brand activity. Because anonymized queries and truncated data can affect query-filter totals, do not expect the two segments to reconstruct the exact unfiltered total.
Track brand and non-brand trends separately. A rise in branded clicks may reflect increased awareness from advertising, publicity, offline activity, or returning customers. Growth in relevant non-brand impressions and clicks is generally more informative when evaluating whether search content is reaching new demand.
How to Export and Interpret Performance Data
The Export option lets you download the current report view to Google Sheets, Microsoft Excel, or CSV. Filters and groupings applied in the interface are included, making exports useful for page inventories, query analysis, period comparisons, and collaboration.
Direct report exports are limited to the table rows available in the interface, generally up to 1,000 representative rows. Report totals can still include data that does not appear in the exported table. For larger datasets, the Search Console API provides more flexible extraction, although it also has row and data limits and does not guarantee every possible row.
Before interpreting an export, record its scope:
- Search Console property.
- Date range and comparison period.
- Search type.
- Applied query and page filters.
- Country and device segments.
- Selected dimensions.
- Export date.
- Whether recent data was preliminary.
This context prevents two exports with different filters from being treated as equivalent. It also makes recurring analysis repeatable.
Do not calculate a simple average of row-level CTR percentages. Combined CTR should be calculated from combined clicks divided by combined impressions. Similarly, position should be weighted by impressions when combining equivalent rows, although differences in aggregation, anonymized queries, and truncation can still prevent a spreadsheet result from matching the interface exactly.
Common Performance Report Mistakes
Most reporting errors come from interpreting a metric without checking how the data was segmented or counted. Avoid the following mistakes:
- Treating average position as a fixed daily rank. It is an average across recorded impressions and conditions.
- Evaluating CTR without position and intent. Low CTR may be normal for a lower position or a query answered directly on the results page.
- Comparing unequal date ranges. Different numbers of days or weekdays can distort the conclusion.
- Ignoring seasonality. Previous-period comparisons may be unsuitable for annual demand cycles.
- Using preliminary data as a final result. Recent figures can still change.
- Expecting table rows to equal chart totals. Row limits, anonymized queries, and aggregation rules can create legitimate differences.
- Comparing Search Console clicks directly with analytics sessions. The systems measure different events and process data differently.
- Applying too many filters at once. Small segments can produce unstable percentages and misleading conclusions.
- Assuming every decline requires a content rewrite. Demand, result layouts, indexing, devices, countries, and technical changes should also be checked.
- Claiming that correlation proves causation. A change after an SEO update supports investigation, not certainty.
Google documents several reasons why chart totals, table values, exports, and analytics data can differ. These include privacy protection, row limits, processing rules, time zones, preliminary data, and property-versus-page aggregation.
Key Takeaways from Google Search Console Performance
The most useful conclusions from the Performance report are based on combinations of metrics and controlled comparisons:
- Use clicks to measure delivered search traffic, impressions to assess visibility, CTR to evaluate click capture, and average position as a directional ranking indicator.
- Compare periods of equal length and account for weekdays, seasonality, reporting delays, and external events.
- Filter a page to discover its queries, and filter a query to discover its landing pages.
- Segment by country, device, and search appearance before making sitewide changes.
- Prioritize high-impression, low-CTR opportunities only when the query, position, and landing page are relevant.
- Diagnose declining pages through their query mix rather than relying only on page-level averages.
- Separate brand and non-brand demand, while recognizing the limitations of query classification and anonymized data.
- Document every export’s filters and scope so that future comparisons remain consistent.
- Treat Search Console patterns as evidence for investigation, not automatic proof of cause.
Summary
The Google Search Console Performance report becomes useful when you move beyond checking whether clicks went up or down. Define the question first, select equivalent date ranges, apply only the filters needed to answer it, and interpret Google Search Console clicks and impressions alongside CTR and average position.
A reliable workflow is simple: identify the affected query or page, segment the data, compare like with like, verify technical assumptions, and make one controlled improvement at a time. Then return to the same report after enough data has accumulated. This approach turns Search Console from a collection of fluctuating metrics into a repeatable system for prioritizing and measuring organic search work.